Get from “we need to look into this” to “here is what needs attention.”
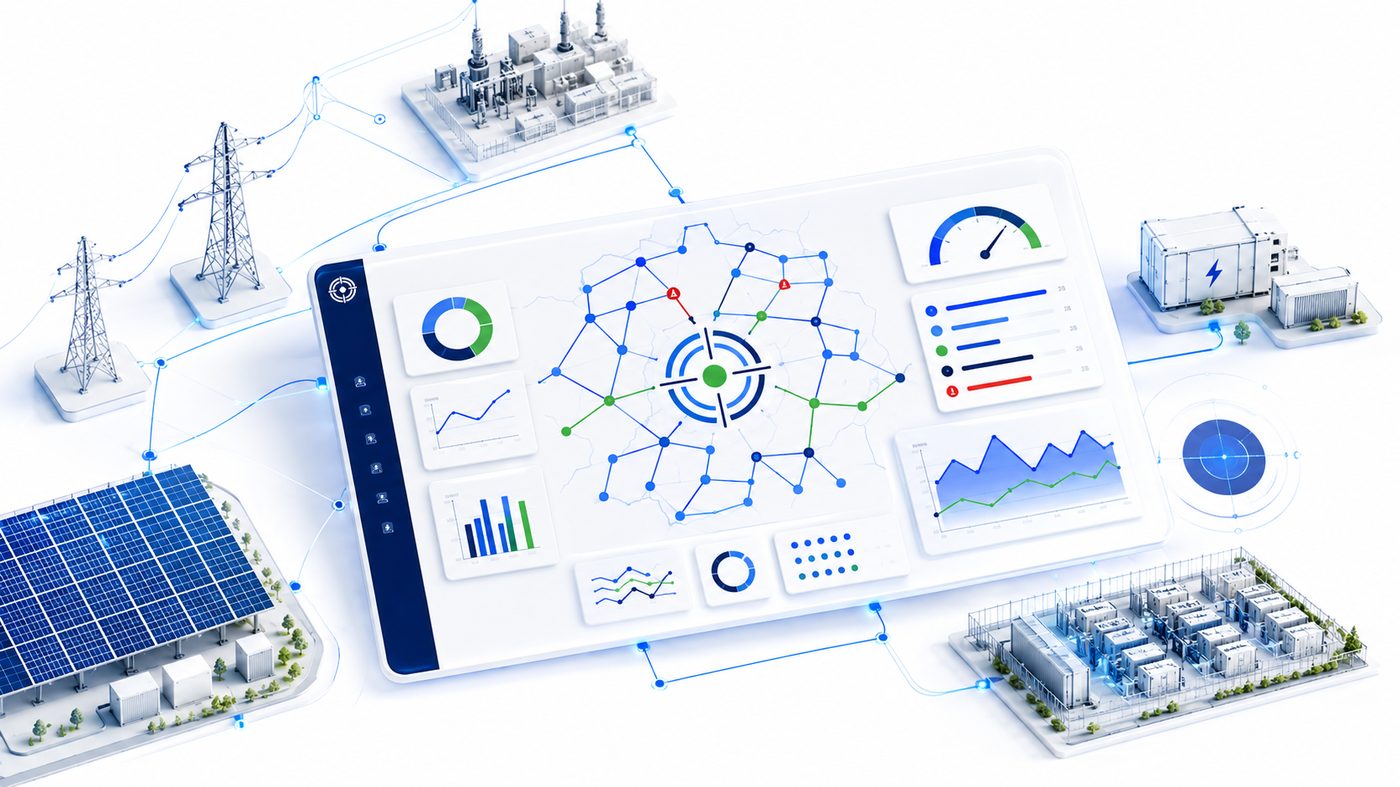
QueueSight compresses scattered queue signals into a decision-ready view: timing exposure, blockage pressure, risk grade, and recommended next steps.
Built for development teams that need answers before another week disappears into manual review.
Save time
Compress manual queue triage.
Turn raw queue uncertainty into a structured project-risk view prepared for review.
Protect value
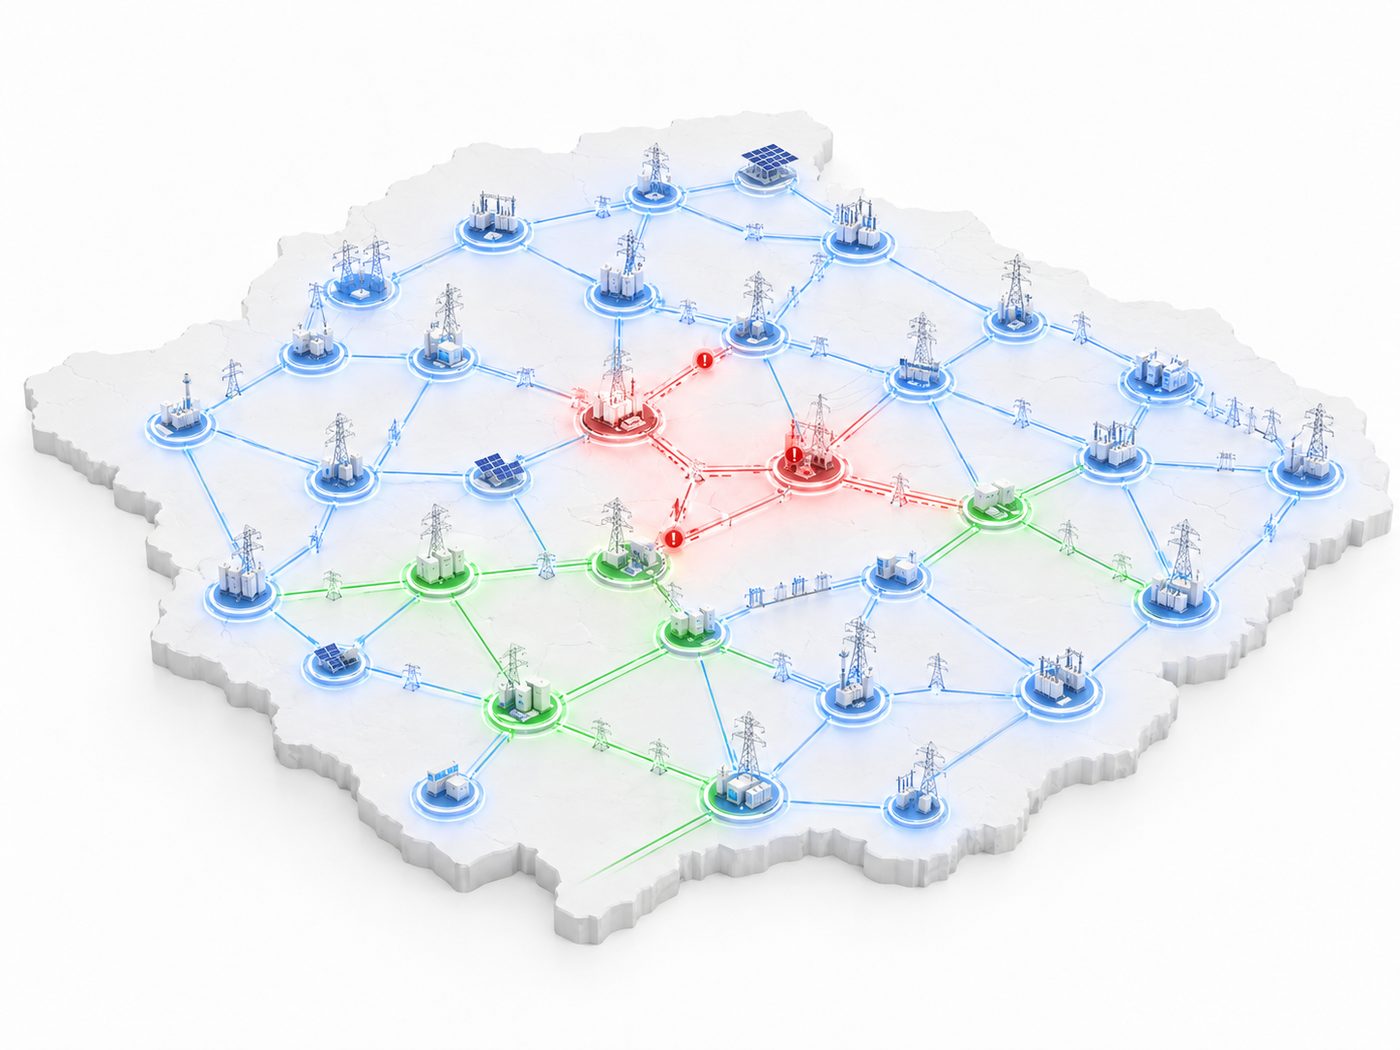
Spot timing exposure earlier.
Surface pressure points before schedule risk quietly compounds into a more expensive problem.
Move smarter
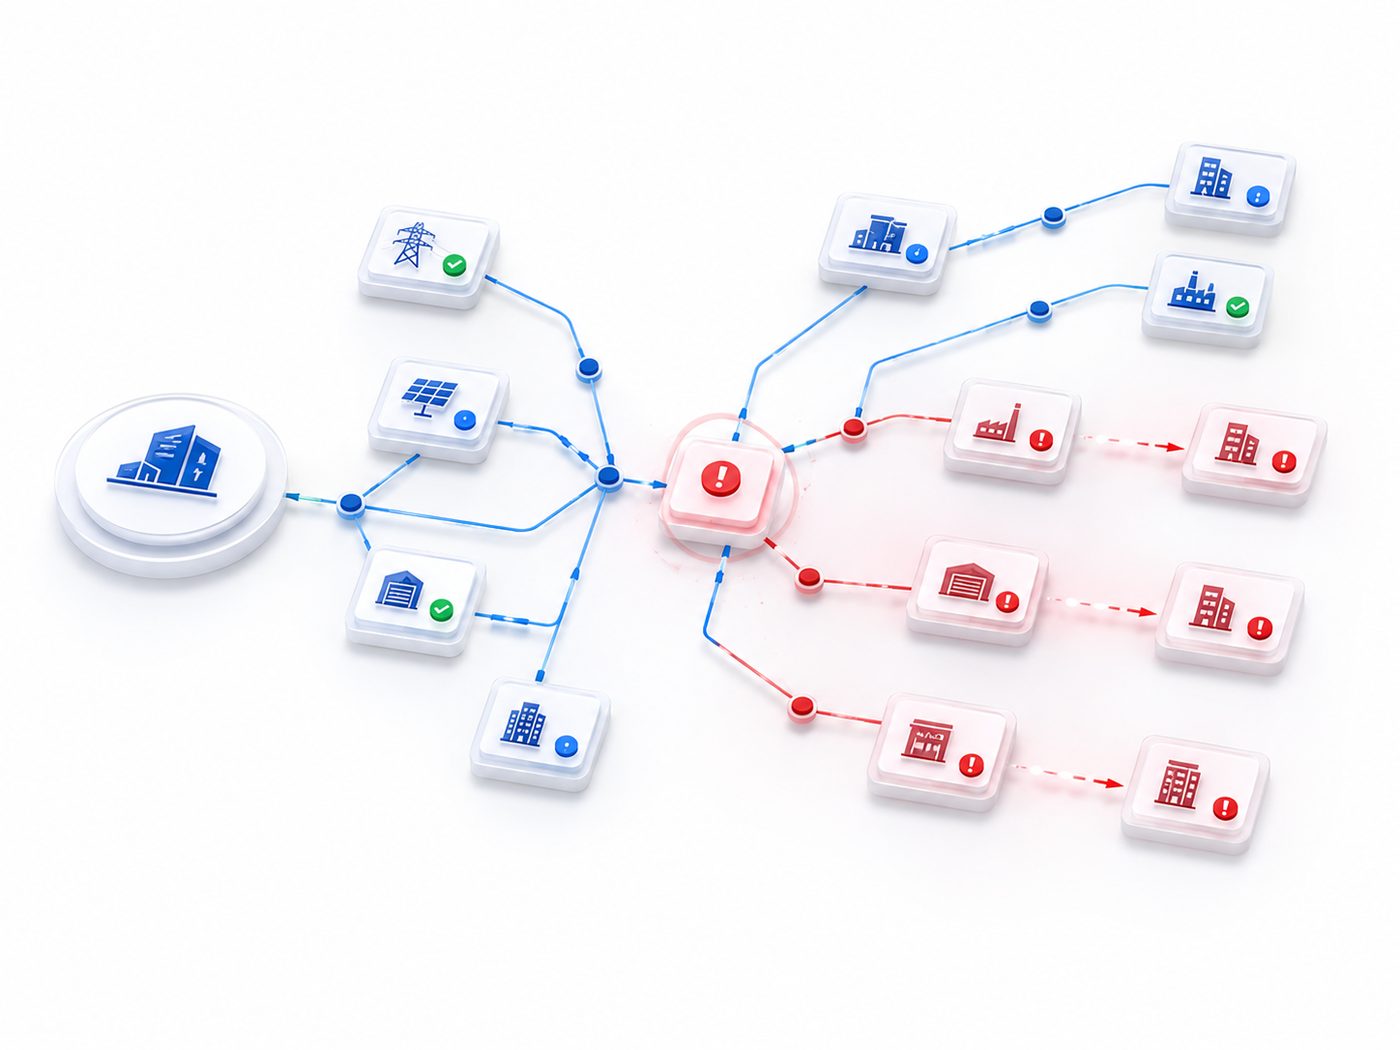
Prioritize the next action.
Decide what to escalate, monitor, de-risk, pause, or review more deeply.